India's $5bn Bet on the Rovuma: Patience, Gas and Energy Security
In 2013 Indian state companies paid over $5bn for a fifth of Mozambique's richest gas block. Thirteen years, an insurgency and a four-year shutdown later, the bet is finally being built. What India owns, what it gets — and what it has cost.
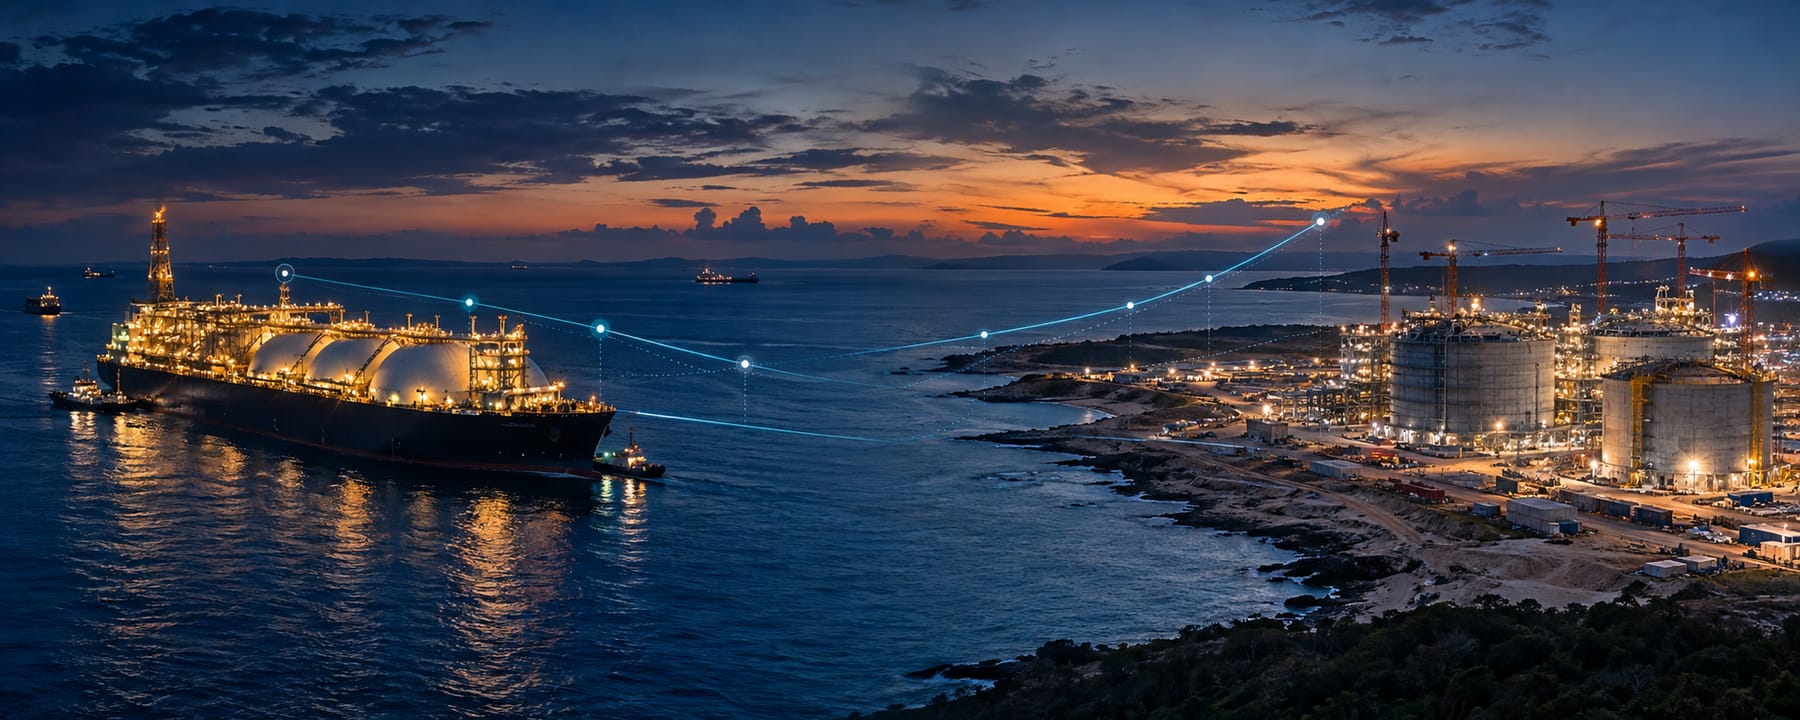
The largest bet India has made in Africa
In the summer of 2013, India's state oil companies made two cheques out for a combined $5.1bn. They bought a fifth of Area 1, an offshore block in northern Mozambique holding one of the largest gas discoveries of the century. Added to the 10% Bharat PetroResources had held since 2008, India suddenly owned 30% of a future LNG export project — more than any other country.
It was meant to deliver gas by the early 2020s. Instead it delivered an insurgency, a four-year force majeure and a long lesson in the patience that frontier energy demands. With construction fully restarted in January 2026, the bet is now being built. This article sets out what India owns, what it will get, and whether it was worth it.
Two cheques in one summer
The first deal came in June 2013. ONGC Videsh (OVL) and Oil India (OIL) agreed to buy Videocon's Mozambican subsidiary, and with it a 10% interest in Area 1, for $2.475bn. Two months later OVL agreed to buy a further 10% directly from the operator at the time, Anadarko, for $2.64bn. Both transactions closed in early 2014.
Today the Indian position sits in three vehicles: ONGC Videsh Rovuma (10%), Beas Rovuma Energy Mozambique — the joint OVL–OIL company that holds the former Videocon interest (10%) — and BPRL Ventures Mozambique (10%). TotalEnergies (then Total), which took over the former Anadarko interest in 2019 after Occidental bought Anadarko, is now the operator with 26.5%.
The price drew criticism in India at the time: roughly $250m per percentage point, paid before a final investment decision. Supporters argued that it bought India something markets could not easily provide — equity in a long-life, Indian Ocean gas source with no chokepoint between it and India's west coast.
Thirteen years from cheque to cargo
- 2008BPRL takes a 10% stake alongside Videocon in an early exploration phase.
- 2013–14OVL and OIL buy 20% for about $5.1bn.
- Jun 2019Final investment decision on the two-train, ~13 mtpa Mozambique LNG project.
- Sep 2019Total acquires the former Anadarko interest from Occidental and becomes operator.
- Mar–Apr 2021Insurgent attack on Palma; force majeure declared, construction halted.
- 29 Jan 2026Full restart of all onshore and offshore activities announced.
- 2029Target for first LNG.
The delay is the real cost of the bet. Capital committed in 2013 will earn its first cash flow, at the earliest, in 2029 — sixteen years later. Meanwhile the Indian partners must also fund their 30% share of construction. On the project's roughly $20bn budget, that is around $6bn of additional equity and debt obligations, by our estimate, on top of the original acquisition price.
India did not buy gas in 2013. It bought an option on gas — and has spent thirteen years paying to keep it alive.
What 3.9 million tonnes means for India
India imported about 25.5 million tonnes of LNG in 2025, and Petronet LNG expects 28–29 million tonnes in 2026. The International Energy Agency projects imports roughly doubling to about 48 million tonnes a year by 2030 as gas demand rises 60%. To meet its goal of a 15% gas share of primary energy, Petronet's chief executive has said India would need more than 100 million tonnes a year.
Against that need, India's attributable share of Mozambique LNG — 30% of 13.1 mtpa, or about 3.9 mtpa — is meaningful but not transformative: roughly 15% of India's 2025 imports, or 8% of the IEA's 2030 projection. Indian buyers also have direct contracts: Bharat Petroleum signed a 15-year agreement for 1 mtpa in 2019.
The strategic value lies in the route as much as the volume. Most of India's LNG comes from Qatar and the UAE through the Strait of Hormuz. Mozambican cargoes sail the open western Indian Ocean directly to Dahej, Kochi or Ennore — supply that is equity-owned and outside the Gulf's chokepoints.
A balance sheet of the bet
Judged by the original timetable, the investment has been a disappointment: returns delayed by most of a decade and capital tied up through an insurgency. Judged by today's energy map — Russian supply disrupted, Hormuz risk elevated, Asian demand rising — owning long-life Indian Ocean gas looks more valuable than it did in 2013.
What to watch
- Construction milestones at Afungi. Progress was reported at about 40% at the January 2026 restart. Each year of delay costs the Indian partners cash flow.
- Offtake routing. How much of India's equity gas is lifted to Indian terminals rather than traded globally.
- Security costs. The project's dependence on Rwandan forces is a risk Indian partners share but cannot control.
- Indian supply chain. Indian engineering, fabrication and services firms have a natural opening on a project that is 30% Indian-owned — an angle Mozambican–Indian joint ventures can exploit.
- Area 1 expansion. Further trains would raise India's attributable volume without a new acquisition price.
Indian capex share is an Economic Intelligence estimate based on ownership and the reported project budget; actual funding structures, including project finance, may differ.
Sources
This report draws on 8 cited sources. View them in Sources cited in every report →
Related insights
 Report
The Quiet Majority: Why Mozambique's Small Firms, Not Its Megaprojects, Will Decide Its Jobs Future
New FinScope data show Mozambique's micro, small and medium enterprises involve 9.3 million people and turn over about 341 billion meticais a month. A critical reading of the numbers — and of a growth model that has bet on megaprojects that employ thousands while small firms carry millions.
 Report
AI Without Industrialisation: Can Africa Leapfrog the Traditional Development Model?
Artificial intelligence promises productivity without factories. We built an original model of job exposure across banking, education, retail, logistics and public administration in Mozambique — and found that the binding constraint is not the algorithm, but electricity, connectivity and paper.
 Report
The Oilseed Corridor: Can Nampula Help Fill India's Cooking-Oil Gap?
On 2 October India's oil industry and the governor of Nampula signed up to explore an oilseed corridor through Nacala. India imports 16 million tonnes of vegetable oil a year; Mozambique sends it almost none. We run the numbers on what the deal could — and could not — achieve.